Pesticides and other pollutants

What is the spatial and temporal distribution of pesticides across Great Barrier Reef ecosystems? What are the (potential or observed) ecological impacts in these ecosystems? What evidence is there for pesticide risk? [Q5.1]
Authors: Andrew P Negri1, Grechel Taucare2, Peta Neale3, Catherine Neelamraju3, Hayley Kaminski4, Reiner M Mann4,5, Michael St J Warne3,6
Affiliations: 1Australian Institute of Marine Science, 2Queensland Alliance of Environmental Health Sciences, University of Queensland, 3Reef Catchments Science Partnership, School of the Environment, University of Queensland, 4Water Quality and Investigations, Science Division, Department of Environment, Science and Innovation, 5Sustainable Minerals Institute. University of Queensland, 6Centre for Agroecology, Water and Resilience, University of Coventry
Evidence Statement
The synthesis of the evidence for Question 5.1 was based on 231 studies, undertaken primarily in the Great Barrier Reef and published between 1990 and 2022. The synthesis includes a High diversity of study types (45% experimental, 29% observational, 18% mixed studies, and 8% secondary) and has a High confidence rating (based on High consistency and High overall relevance of studies).
Summary of findings relevant to policy or management action
Pesticides are ubiquitous across monitored Great Barrier Reef ecosystems including end-of-catchment waterways, palustrine wetlands (e.g., vegetated swamps) and in estuarine and nearshore marine habitats. Concentrations of pesticides are greatest in wetlands, followed by end-of-catchment then marine locations, with concentrations decreasing with greater distance from river mouths. The majority of pesticides in all Great Barrier Reef habitats occur as mixtures. Exposure of marine ecosystems to pesticides is closely linked to flood plume dispersal and is highly dynamic, changing by orders of magnitude within hours. Based on the available, but limited, published data, there is more evidence that pesticide concentrations are increasing rather than decreasing in Great Barrier Reef marine ecosystems. Pesticides are designed to control agricultural pest species and virtually all tested pesticides are reported as harmful to non-target aquatic species of the Great Barrier Reef. For example, photosystem II (PSII) herbicides consistently impact all photosynthetic marine organisms of the Great Barrier Reef that have been tested, including corals and seagrass. Other simultaneous pressures, including heatwave conditions and variation in light were shown to increase the sensitivity of Great Barrier Reef species to pesticides, indicating that guideline values applied under some conditions in the field are likely to underestimate the risk to aquatic ecosystems. The guideline values in the Pesticide Risk Metric were used to assess the simultaneous exposure risks of 22 pesticides on aquatic species in the Great Barrier Reef. Sites in the Mackay Whitsunday region, along with Barratta Creek in the Burdekin region which featured intense cropping and lower discharge (related to rainfall), recorded consistently higher concentrations of pesticides and higher risk than other locations. Pesticides that contribute most to risk in all Great Barrier Reef ecosystems monitored include atrazine, diuron, imidacloprid and metolachlor, but their contribution varies with site. Risk to aquatic ecosystems reduces with distance from the source of pesticides.
Supporting points
- Extensive monitoring programs in the Paddock to Reef program (primarily the Great Barrier Reef Catchment Loads Monitoring Program and the Marine Monitoring Program) have consistently identified pesticides in >99% of water samples. Since 2016/17: 1) over 70 pesticides and their transformation products have been identified in Great Barrier Reef waters; 2) most pesticides were detected as mixtures (>70% of samples); 3) the most frequently quantified pesticides across all Great Barrier Reef habitats were atrazine, diuron, hexazinone, imazapic, imidacloprid and metolachlor.
- Pesticide concentrations were typically higher in fresh and marine waters during wet seasons compared to dry seasons, with rapid increases at the start of the wet season followed by a gradual decrease.
- The concentration of imidacloprid at some freshwater sites and PSII herbicides at some marine sites has increased.
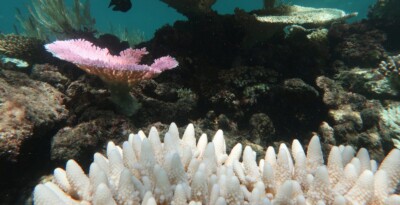
- The effects of PSII herbicides on photosynthetic efficiency have been measured in Great Barrier Reef species including seagrass, coral, coral symbionts, algae and jellyfish and include reduced growth and mortality (if assessed). Laboratory tests indicate that contemporary insecticides negatively affect marine invertebrates including corals, barnacles, crabs, shrimp and prawns and fish. Non-PSII herbicides and fungicides have also been shown to negatively affect Great Barrier Reef species, but more research is needed to improve water quality guideline values for these pesticides.
- An extensive review of toxicity studies with species relevant to the Great Barrier Reef found that the Pesticide Risk Metric Guideline Values are suitable to assess the risk of pesticides and pesticide mixtures.
- In line with international evidence, several experimental studies on species found in the Great Barrier Reef have shown that mixtures of herbicides generally conform with the concentration addition model of joint action. Additional studies focused on Great Barrier Reef species would strengthen current evidence that low concentrations of individual pesticides with different modes of action contribute to the overall effect of the mixture.
- All in situ biological studies to date have found strong correlations between adverse biological effects and concentrations of individual pesticides, sometimes with pesticide mixtures. However, the adverse effects might also be correlated with other co-stressors in the field, so it has not yet been possible to determine causation.
- A simulation exercise using the eReefs marine model indicated that diuron is typically transported by coastal plumes in a northward direction from river mouths. Rapid changes in diuron concentrations (within hours) highlighted the dynamic exposure of marine waters and that the Pesticide Risk Metric PC99 Guideline Value for this herbicide was often exceeded across 1,000 km2 (peaking at 1,400 km2) of inshore areas in simulations from 2016 to 2018 (including 175 km2 of seagrass and 20 km2 of coral habitat). Further model developments are required to improve the ability to estimate patterns of pesticide risk, such as expanding the model to include all pesticides identified in the Great Barrier Reef, and additional in situ field validation using observations of pesticide concentrations from the Marine Monitoring Program.
