Dissolved nutrients

What is the spatial and temporal distribution of nutrients and associated indicators within the Great Barrier Reef? [Q4.1]
What is the variability of nutrients in coastal and marine areas of the Great Barrier Reef? [Q4.1.1]
Authors: Barbara Robson1,2, Aimee Brown3, Sven Uthicke1
Affiliations: 1Australian Institute of Marine Science, 2AIMS@JCU, 3Private consultant
Evidence Statement
The synthesis of the evidence for Question 4.1 was based on 106 studies undertaken in the Great Barrier Reef and published between 1990 and 2022. The synthesis includes a High diversity of study types (55% original in situ data, 8% reviews, 37% either new analyses of existing data, modelling studies, or remote sensing), and has a Moderate confidence rating (based on High consistency and Moderate overall relevance of studies).
Summary of findings relevant to policy or management action
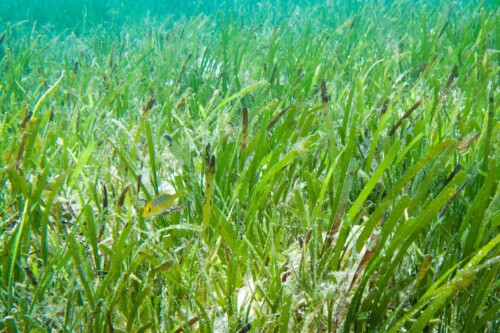
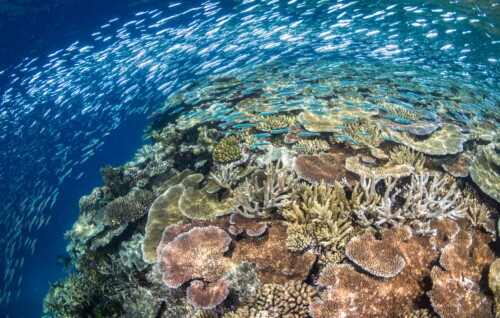
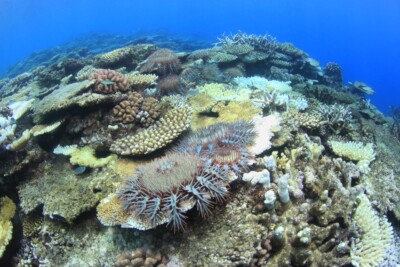
Understanding the distribution of nutrient concentrations, and how they change over time, is important because nutrients, especially nitrogen and phosphorus, play a crucial role in the water quality and overall health of Great Barrier Reef ecosystems, supporting coral reefs, seagrass meadows and fisheries. Multiple lines of evidence demonstrate that nutrient concentrations originating from land-based activities follow a cross-shelf gradient with the highest concentrations found in estuaries and inshore waters and lower concentrations in offshore waters. Peak concentrations of dissolved organic and inorganic nutrients are usually found during the wet season (typically December to May) in the central and southern Great Barrier Reef (approximately from Cooktown to Gladstone) adjacent to areas of more intensive catchment development and in waters influenced by river discharge. Weather patterns, river discharge and associated land-based inputs, as well as marine processes such as upwelling and nitrogen fixation are among the key drivers of nutrient variability. Nutrient concentrations vary from year to year and are highest in years of high rainfall and river discharge, and storm activity (typically La Niña years). Inshore nutrient concentrations can also vary over short timescales due to tidal movements and diurnal fluctuations in photosynthetic and metabolic activity. Changing land use has increased nutrient loads exported to the Great Barrier Reef, and both modelling and coral core studies strongly suggest that this has increased nutrient concentrations in inshore and (to a lesser extent) midshelf waters.
Supporting points
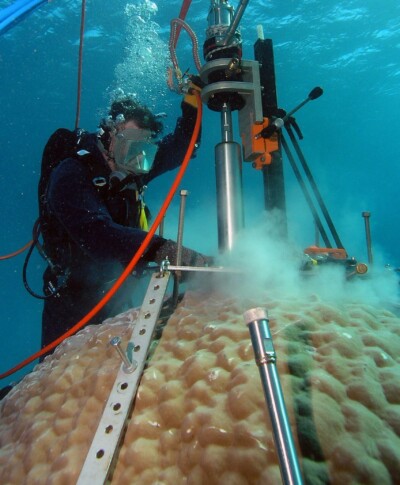
- Multiple lines of evidence provide a temporal record of nutrient distribution across the whole Great Barrier Reef. This includes coral core data that provides insight into pre-development conditions, ocean colour data extending back to 1969, data from ad hoc in situ studies from the 1990s, and routine monitoring from 1989 at some locations (e.g., the ‘Cairns transect’ from the Barron River mouth to midshelf areas) to present. The majority of studies focus on inshore and/or midshelf waters, with relatively few studies including estuary or offshore nutrient concentrations. The largest source of inshore nutrient data is the Great Barrier Reef Marine Monitoring Program which started in 2005.
- Multiple datasets show that total phosphorus, total nitrogen, dissolved inorganic nitrogen, phosphate and silica concentrations follow a cross-shelf gradient from higher values in estuaries, mangrove creeks and inshore waters to lower values in midshelf waters. In offshore waters, relatively high concentrations of dissolved inorganic nitrogen and chlorophyll a can sometimes occur in areas of oceanic upwelling.
- Concentrations of total phosphorus, total nitrogen, dissolved inorganic nitrogen and phosphate are elevated in flood plumes (relative to ambient concentrations) and in areas of sediment resuspension. Chlorophyll a concentrations are also elevated in flood plumes where light is sufficient. Silicate concentrations follow similar spatial patterns but have not been as well studied. Little observational data is available for micronutrients, including iron.
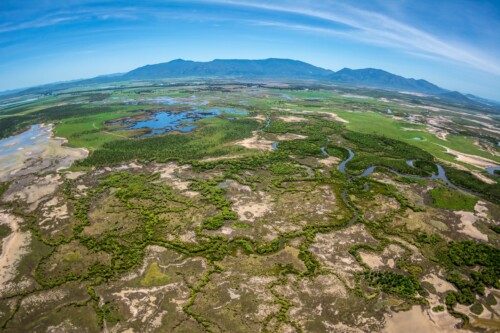
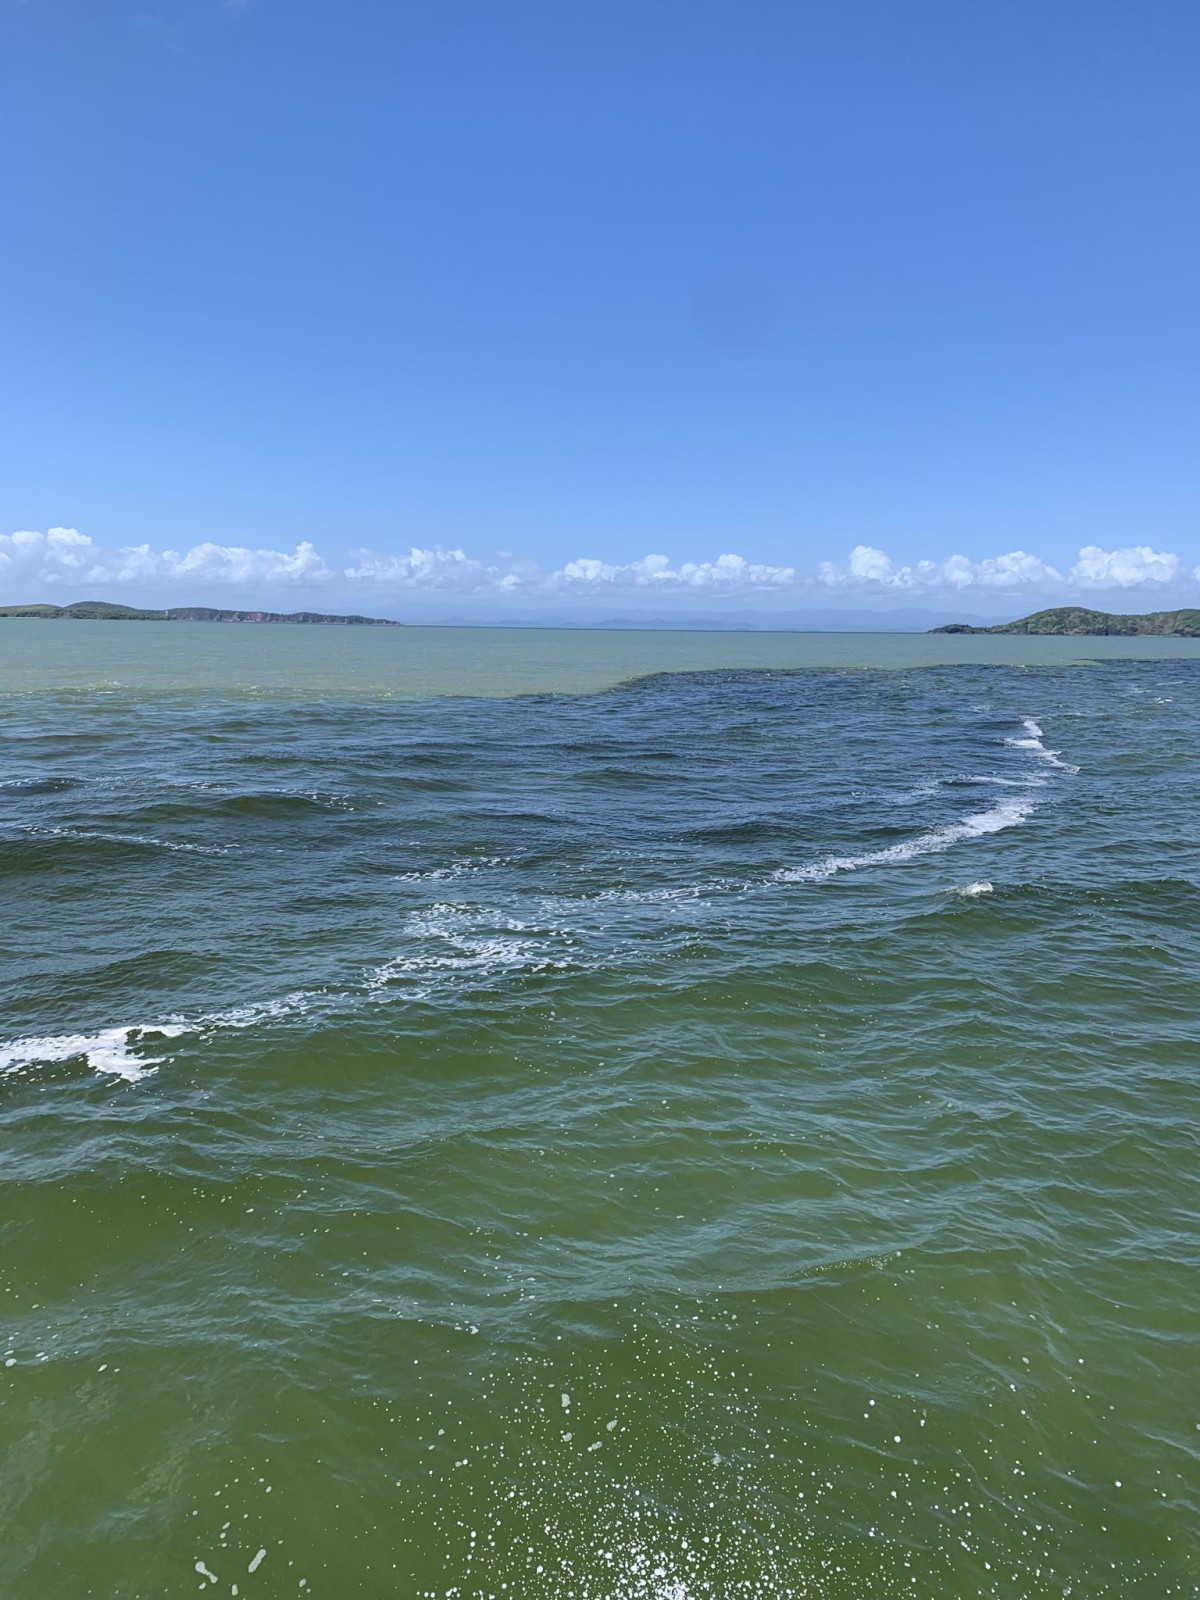
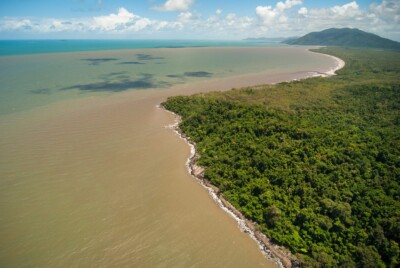
- Flood plumes in the Great Barrier Reef, carrying land-based nutrients and other pollutants, are usually constrained to distances within 25 kilometres of the coast, but can extend up to 50 kilometres from the coast after major flood events into midshelf waters. In general, the spatial extent of flood plumes is greater in the central and southern Great Barrier Reef than in the Cape York region. Most flood plumes travel northwards up the coast from their source rivers, though this can vary with the wind direction and rate of river discharge.
- Most terrestrial particulate nutrients are deposited within 10 kilometres of river mouths, but dissolved nutrients are carried further and are taken up by biota and transformed into phytoplankton biomass (measured as chlorophyll a). Higher chlorophyll a concentrations are often observed in the mixing zones at the edge of flood plumes.
- A substantial proportion of particulate organic nitrogen and phosphorus that is deposited in sediments in estuaries and at river mouths is later remineralised, releasing dissolved nitrogen and phosphorus into the water column so that nutrient concentrations in inshore and some midshelf areas remain elevated even after the flood plumes have dispersed.
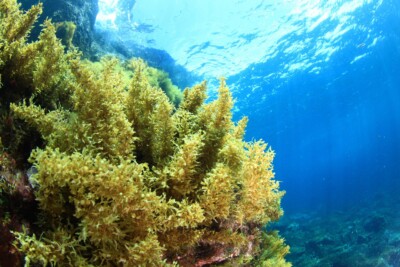
- Offshore and midshelf variations in nutrient concentrations in surface waters are often associated with upwelling events (which sometimes bring dissolved inorganic nitrogen and phosphorus from deeper water to the surface) and Trichodesmium blooms (which fix atmospheric nitrogen). There is some evidence that both upwelling and Trichodesmium blooms are more common in La Niña years.
- There have been clear temporal trends in inshore nutrient concentrations collected through the Marine Monitoring Program since 2005. Nitrite and nitrate concentrations have increased in all monitored inshore regions, which includes the Wet Tropics, Burdekin and Mackay Whitsunday marine Natural Resource Management regions, and particulate nitrogen has increased in the Wet Tropics region. In some regions, there has been a reduction in phosphate since 2017, and in the Mackay Whitsunday region, there has been a reduction in chlorophyll a. There is not enough long-term monitoring data to assess temporal trends in the Cape York, Fitzroy or Burnett Mary regions, and there is no long-term monitoring program in the Burnett Mary region to support this type of assessment in the future.
- To obtain a more complete picture about nutrient distributions in the Great Barrier Reef, future steps could include characterising organic nutrients and their link to land-based inputs, exploring the time scales over which changes in land-based inputs may affect marine nutrient concentrations, analysing long-term coastal and marine nutrient datasets to better understand the effects of land management changes, quantifying nutrient variability from marine sources, and updating Great Barrier Reef-wide nutrient budgets (quantifying all sources, sinks and stocks of nitrogen and phosphorus).

Related questions

Related topic summaries